Reviewed October 2026. The pyramid is one of the artefacts of our Converge Methodology; this guide is the long version of how it works and how to use it with scoring to produce a portfolio a board can act on.
Contents: The problem it solves · The four layers · Time, not value · Layer by layer · Reading an opportunity’s layer · Pairing the pyramid with scoring · The five data positions · Building a portfolio · A worked portfolio · Common misuses · The pyramid in the boardroom
The problem it solves
Discovery produces a long list. Thirty, fifty, eighty opportunities from across the functions, each with a champion. The usual next step is to score them on value and feasibility and take the top ten, and the usual result is a top ten that is all ambitious, all data-hungry, and all a year away, because value scores favour big ideas and feasibility is scored optimistically by the people proposing them. The programme then spends its first two quarters on foundations for projects nobody has seen working, loses momentum, and is remembered as a pilot that stalled.
The pyramid adds one question that scoring does not ask: how long, realistically, from decision to running? It sorts every opportunity into one of four layers by time to deploy, and the answer changes what a sensible first year looks like.
The four layers
From base to apex:
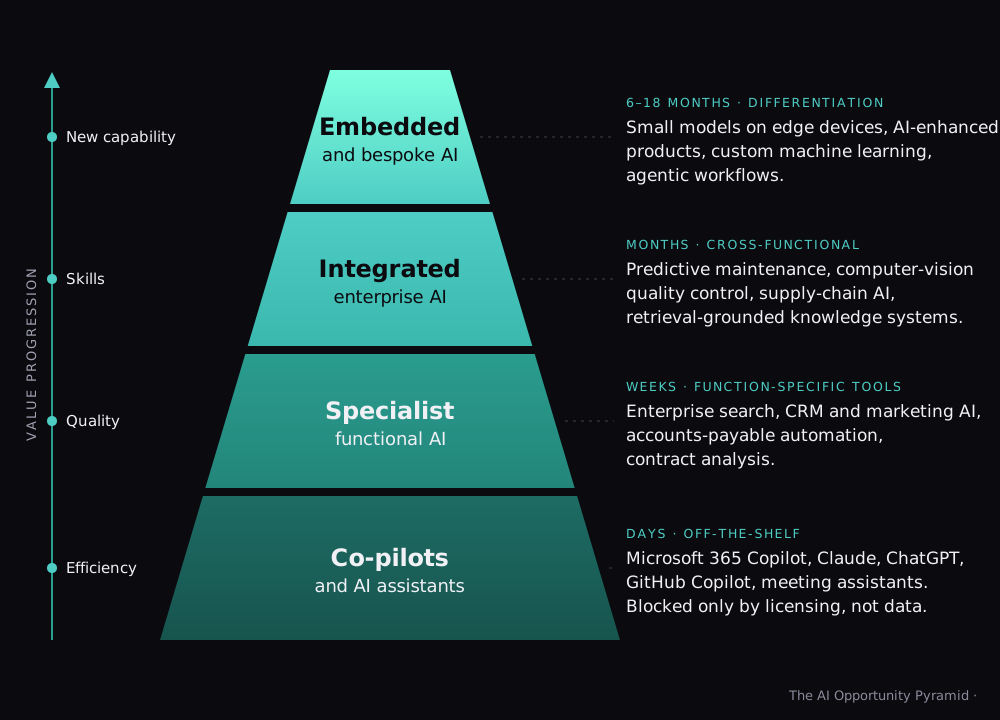
- Co-pilots and AI assistants. Off-the-shelf enterprise assistants: Microsoft 365 Copilot, Claude, ChatGPT Enterprise, GitHub Copilot, meeting assistants. Deployed in days. Blocked only by licensing and policy, never by data. Value: efficiency across everyone.
- Specialist functional AI. Function-specific tools: enterprise search, CRM and marketing AI, accounts-payable automation, contract analysis, support tooling. Deployed in weeks. Value: quality and consistency in a function.
- Integrated enterprise AI. Cross-functional systems on your own data: predictive maintenance, computer-vision quality control, supply-chain AI, retrieval-grounded knowledge systems. Months. Value: skills and capability across functions.
- Embedded and bespoke AI. AI in products, small models on edge devices, custom machine learning, agentic workflows. Six to eighteen months. Value: differentiation and new capability.
The axis up the side is value progression: the layers move from efficiency through quality and skills to new capability. The width is how much of the business each layer touches: the base reaches everyone; the apex is a few strategic bets.
Time, not value
The pyramid’s axis is deliberately time to deploy, not value. Value is what scoring measures, and the two are kept separate so that each can be read on its own. An opportunity can be high value and base layer (an enterprise assistant rolled out properly often is) or high value and apex (a product feature that opens a market). The pyramid does not tell you which to do; it tells you how long each will take and therefore how to sequence what scoring says is worth doing. Programmes that stall almost always have a top-ten made entirely of layers three and four, and the pyramid makes that visible before the budget is committed.
Layer by layer
Layer 1, co-pilots and assistants. The layer most businesses underestimate. Rolled out as “here’s a licence”, it produces a third of staff using it for drafting. Rolled out with governed access, function-specific training, a prompt library and champions, it produces most staff using it for most of their text-handling work, which in a knowledge business is a measurable share of the working week. It is also the layer that satisfies the EU AI Act’s literacy duty, builds the habits every other layer depends on, and surfaces the early adopters who become layer-two and layer-three pilots’ owners. Weeks to do well, days to do badly.
Layer 2, specialist functional AI. Products, mostly bought, for one function. The decision here is the build, buy, partner or wait framework: standard workflow and general knowledge means buy; our knowledge in a standard shell means buy the shell and build the grounding. A knowledge assistant over a function’s documents sits at the top of this layer and is the most common first build we do, because the data is documents (which exist) and the cost of error is low with citations.
Layer 3, integrated enterprise AI. Cross-functional, on your own operational data, and so dependent on the data position. This is where predictive maintenance, demand forecasting, anomaly detection, computer vision and the serious knowledge systems live, and where most of the measurable return in an industrial or operational business is. Months, because the data foundation and the integration are most of the work; the model is usually the easy part.
Layer 4, embedded and bespoke AI. AI that is part of the product or the service: on-device models, AI features customers pay for, agents that act across systems, custom models where nothing off the shelf fits. The differentiating layer and the slowest, with the highest cost of error and the most governance. One or two of these, chosen well, is a strategy; six is a wish list.
Reading an opportunity’s layer
In consolidation, each opportunity is placed by asking:
- Does an off-the-shelf tool do this, needing only licensing and training? Layer 1.
- Does a function-specific product or a document-grounded assistant do this, within one function? Layer 2.
- Does it need our operational data joined across systems, or a model trained on our history? Layer 3.
- Is it part of what we sell, or does it act autonomously across our systems? Layer 4.
Disagreements about layer are useful. They usually mean the opportunity is two opportunities (a layer-2 assistant now and a layer-3 system later), and splitting it is often the right move: the layer-2 version ships this quarter and builds the knowledge the layer-3 version needs.
Pairing the pyramid with scoring
Scoring, in our method, uses the convergence scorecard and produces a value and a feasibility for each opportunity. The pyramid adds the layer. Plot them: priority on one axis, layer on the other. Four regions appear:
- High priority, low layer. Do now. This is the first quarter.
- High priority, high layer. The strategic programme. Start the foundations now; expect results in quarters, not weeks.
- Low priority, low layer. Do cheaply if someone wants to, or fold into the base-layer rollout.
- Low priority, high layer. Park, with a date.
“Valuable” and “valuable and ready now” are different things, and this is the view that separates them. A board sees it in one picture.
The five data positions
The layer and the data position together decide the sequence. Every opportunity gets one of five positions:
- Data exists, reachable, trusted. Go.
- Data exists, reachable, not trusted. Go, with ground truth from documents or a reconciliation step.
- Data exists, not reachable. An extraction path first; scope it as its own piece of work.
- Data partly exists. A capture or instrumentation project first, which may itself be a good project.
- Data does not exist. Wait, or redesign the opportunity around data that does.
A layer-3 opportunity in position 1 can be faster than a layer-2 opportunity in position 3. The data readiness page covers how we assess it.
Building a portfolio
A first-year portfolio that works has a shape:
- Base layer, done properly, in the first quarter. Governed access, policy, training by function, champions. It funds itself and builds the habits.
- Two or three layer-2 wins in the first two quarters. Chosen for readiness and visible value; a knowledge assistant, a functional tool, a document-intelligence piece.
- One layer-3 programme started, with its data foundation as the first phase. Results in the second half of the year.
- One layer-4 bet, scoped and decided, started only if the strategy demands it. Most first years should not start one; they should decide whether to.
Sequenced this way, something is running within weeks, the layer-2 wins pay for the layer-3 foundation, and the organisation that reaches the layer-4 decision has a year of evidence and skill behind it.
A worked portfolio
A manufacturer’s discovery produced forty-one opportunities across engineering, service, operations, sales and finance. Scored and layered:
| Opportunity | Priority | Layer | Data position | Sequence |
|---|---|---|---|---|
| Enterprise assistant rollout with function training | High | 1 | n/a | Q1 |
| Engineering knowledge assistant over standards and SOPs | High | 2 | 1 | Q1–Q2 |
| Quote drafting from specification and history | High | 2 | 2 | Q2 |
| Service-ticket triage and first response | High | 2 | 1 | Q2 |
| Predictive maintenance on installed base | High | 3 | 3 | Foundation Q2, results Q4 |
| Demand forecasting across plants | Medium | 3 | 2 | Q3 |
| On-device diagnostics in product | High | 4 | 4 | Decide Q4 |
| Automated supplier negotiation | Low | 4 | 5 | Park |
Eight of forty-one in the first year; the rest sequenced behind them or parked with dates. The board approved the picture in one meeting, because the picture was the argument.
Common misuses
- Treating the layers as a ladder. You do not have to finish layer 1 before starting layer 3; you have to start the layer-3 foundation early because it takes longest. Run layers in parallel, sequenced by time.
- Scoring by layer. The apex is not more valuable because it is at the top. The axis is time.
- Putting everything at layer 4. Ambition inflates layers. The test questions above are deliberately mechanical.
- Skipping layer 1 as trivial. It is the fastest return, the governance baseline and the training ground. Skipping it is the most common mistake in programmes led by engineering.
- Ignoring data position. The layer says how long if the data is there. The position says whether it is.
The pyramid in the boardroom
The reason we use it is that it fits on one slide and a non-technical board understands it in a minute: four layers, time up the side, our opportunities placed on it, the first year highlighted. It replaces the forty-row spreadsheet with a picture that makes the sequencing argument by itself, and it gives the board a vocabulary (“that’s a layer-three with a data problem”) that lasts beyond the meeting. Our opportunity prioritisation engagement produces that slide, with the scored portfolio and the sequence behind it; the pyramid page has the diagram in full.